A First Glance at the IRC Logs
1 October 2014
Way back in the days of my undergrad, Carl Ellis started an IRC channel for the good folks of Lancaster Uni’s computing society. As we’ve all moved on and got various jobs (and moved to other countries), IRC’s been one method of staying in touch. We now have members in Europe, Japan, America and even Coventry.
Since about 2010 we’ve kept logs, originally using eggdrop. These were converted to the new format when LUGod was developed. Time for some analysis.
Message Counts
First up, some basic counts. The logs have 429000 entries at the time of writing, and our oldest entry is from the 2nd of April, 2010 at 8:03 am:
[Carl] Its an issue with threaded tcl, I was just confirming something, I have a patch to apply and then it should work
Fascinating. That means we’ve expressed 252 messages and ~1800 words per day, but with a standard deviation of around the same figures.
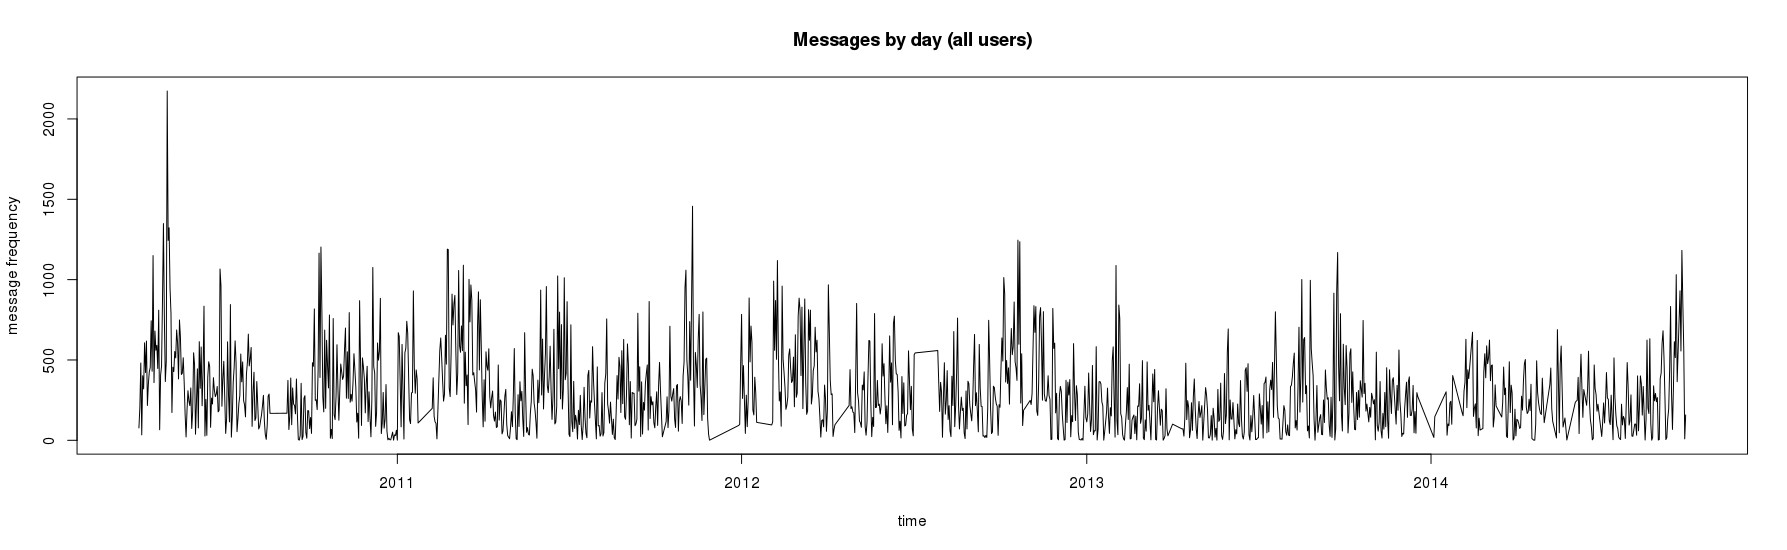
There’s less of a pattern here than I thought, but I’ll bring in the multivariate stuff later, maybe. The 2nd of May 2010 was the most voluminous day, seeing a total of 2174 messages and 15197 words. Note that the plot above is smoothed using a month-long running median for clarity: to see the original, click the plot. The words/day graph looks identical: as one might expect they are correlated with a PMCC of 0.986.
I did also plot the above graph per-user, expecting to see when people started/stopped using IRC, or when they got a job etc. In reality there wasn’t much of a trend, and it was a simply awful graph to read, so I saved you all the eye pain.
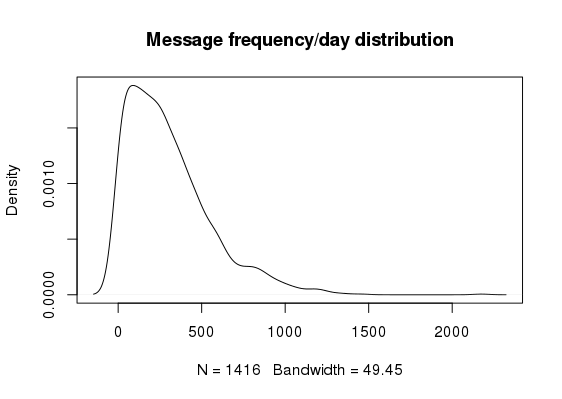
The distribution looks like that ↑. It’s rather poissony, and a crude model indicates that λ hovers somewhere around 5.7 posts.
Hourly
Though many of us have shuffled timezone at some point, the channel remains mainly active during GMT daytime, with the usual skew for a ‘right biased’ sleep pattern.
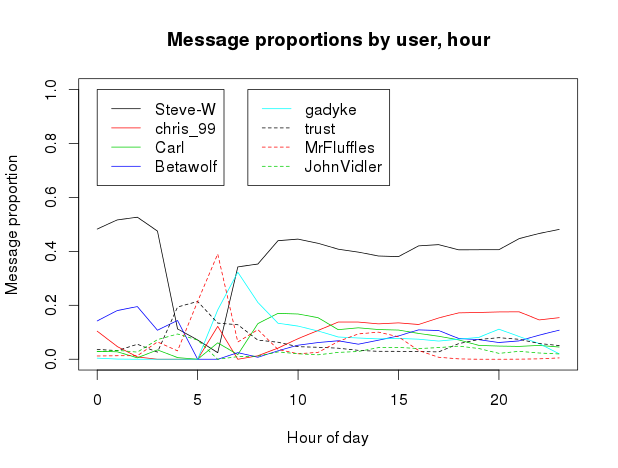
The hourly plot is disappointingly unsurprising, though by far the most interesting feature is the ’tea time lull’ between about 6 and 8pm. This is also the time a lot of us leave the office. Note that the word plot is almost identical again: we don’t seem to get more verbose by hour (this is backed up by fitting a linear model, which indicates that all of the variation is explained by hour alone). Clicking the image will send you to a breakdown of who is speaking as a %age of the overall population at each hour. This shows that most people in the channel participate in the afternoon notch, and also that I should get a life.
There’s also this plot, that shows how much of each user’s output is spent on each hour of the day:
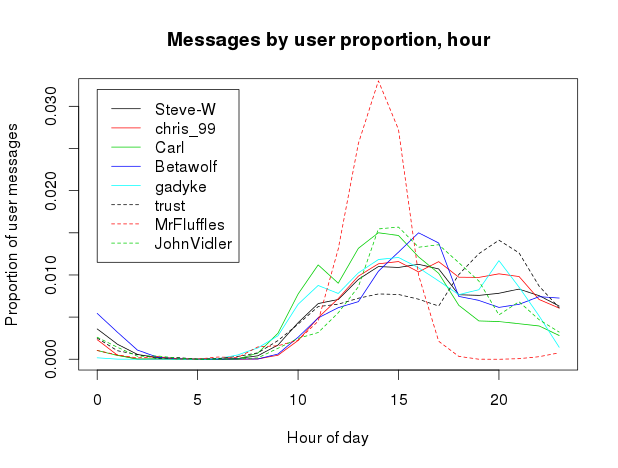
This reveals some geographical traits, particularly MrFluffles’ falloff reflecting his timezone (which is ten hours behind GMT): since he can’t converse in the middle of our night either, this results in remarkably ‘condensed’ IRCing-time.
People
For this, we needed to normalise all the usernames using a big mapping. This was done with a bit of guesswork because some of them are pretty ancient, or simply didn’t stick around for long. We think we got most of the major players.
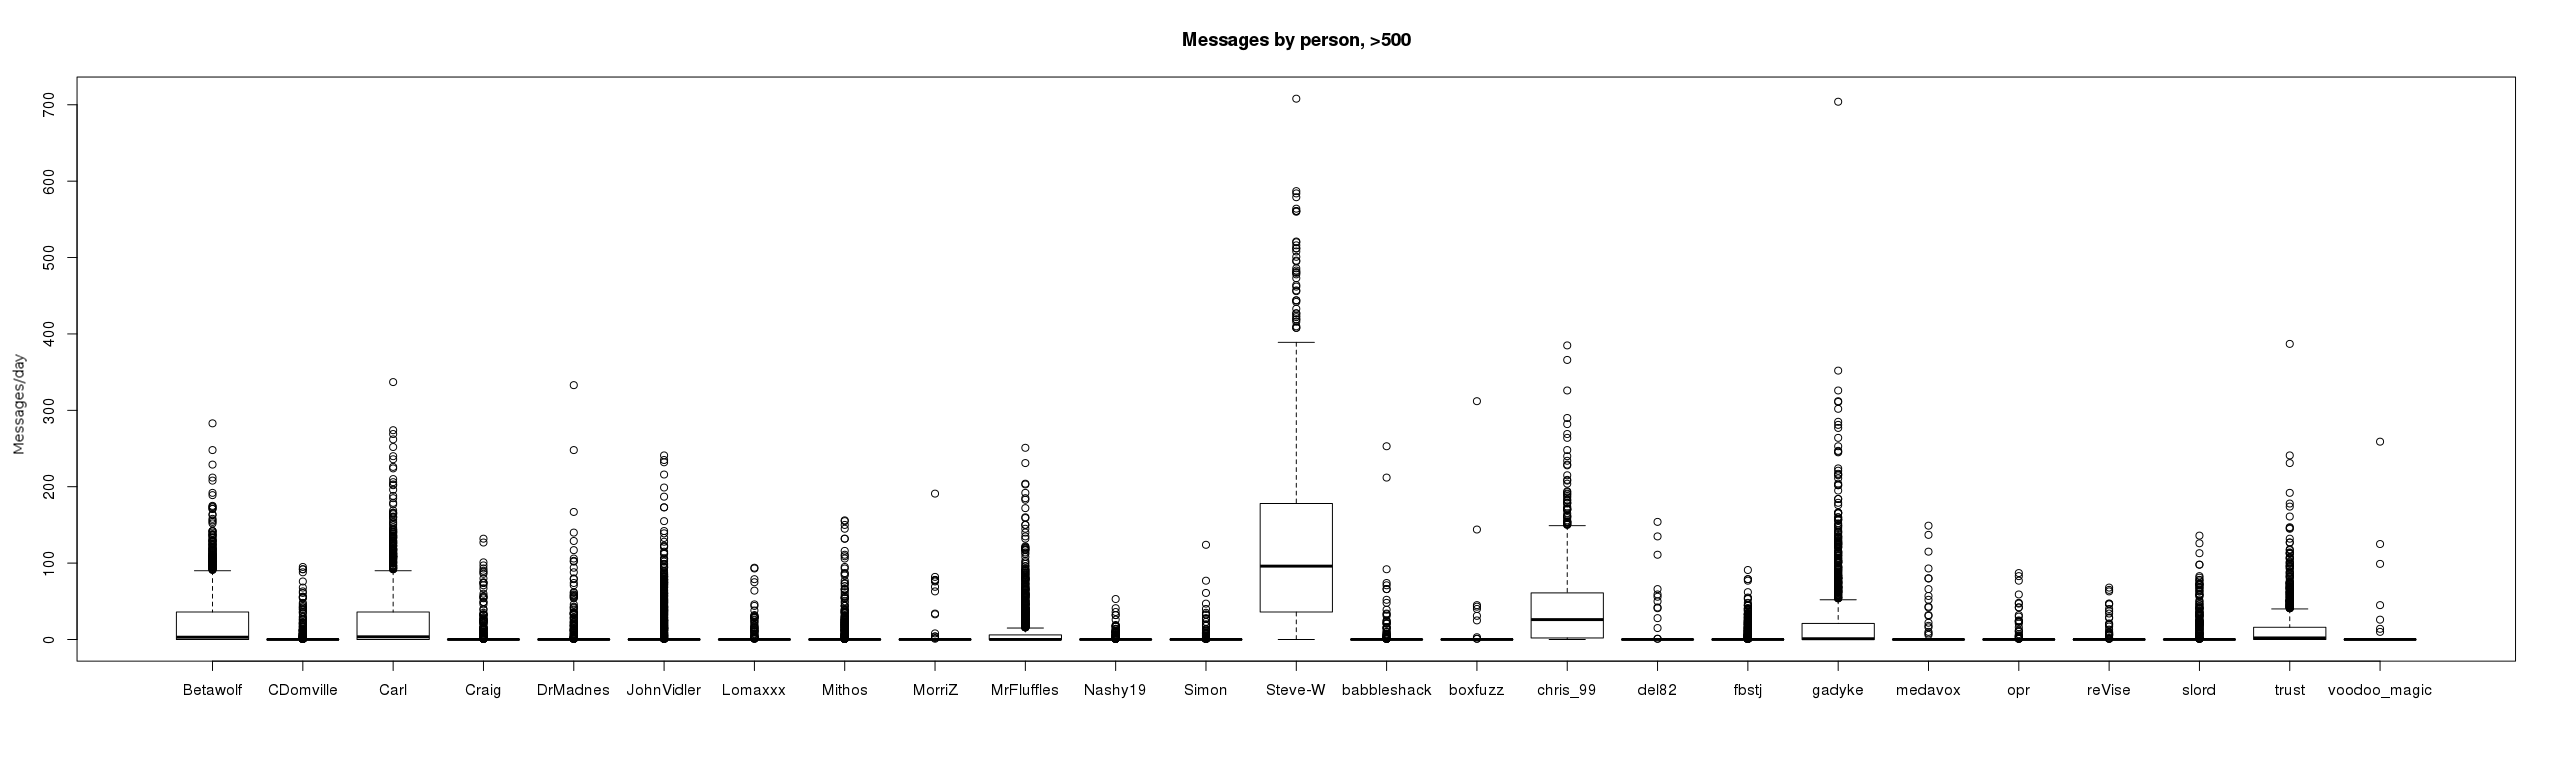
The breakdown of messages/day per person is provided in the plot above. The thumbnail shows those with message counts above 5000, and the full graph shows those who have sent over 500 messages.
If we take the per-day-per-person results, we should be able to get a crude measure of who speaks most often with whom by creating a correlation matrix:
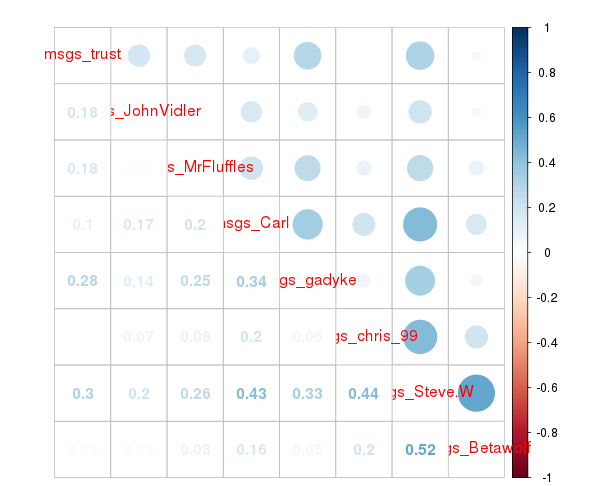
Apologies for the messy labels, that’s just the way corrplot seems to do them. This graph is crude because it fails to take into account conversations that go over GMT (or BST) midnight, or many happening throughout the day. It indicates various social allegiences I won’t comment on, and the overall blue nature of the plot indicates that the channel tends to speak as a whole (at least when viewed with daily granularity).
Total word counts per person are as below. Again these are truncated for those under 5000 messages:
| person | msgs | words | words/msg |
|---|---|---|---|
| Steve-W | 172,608 | 1,320,919 | 7.65 |
| chris_99 | 57,566 | 342,392 | 5.94 |
| Carl | 36,465 | 251,153 | 6.88 |
| Betawolf | 33,605 | 249,573 | 7.42 |
| gadyke | 31,703 | 292,214 | 9.21 |
| trust | 18,856 | 107,276 | 5.68 |
| MrFluffles | 15,126 | 78,012 | 5.15 |
| JohnVidler | 13,871 | 98,667 | 7.11 |
I’ve been quietly waiting until I had a million words of my own text to start some other projects, which will hopefully eventually turn up here. yey.
Tune in next time for some linguistic models and hopefully some generative stuff. It’d be fun to use a semantic tagger or LDA to identify the topics we speak about, for example.